


1 min read
🚁 6 Drone Physics Experiments That Will Make Your Students Love STEM
📡 Flight + Physics = Engagement Drones aren't just cool tech – they're powerful teaching tools. At Nicholls State University, a group of creative...
15 min read
For Teachers: This is a complete, ready-to-assign lab activity for grades 6–10 aligned to NGSS MS-PS3-1 and MS-PS3-5, with extensions for HS-PS3-1 and HS-PS3-2. Students use a PocketLab G-Force or PocketLab Voyager sensor to measure velocity in real time as a cart rolls down a ramp, then calculate gravitational potential energy (GPE) and kinetic energy (KE) at multiple positions.
At a glance: Estimated time: 45–90 min | Sensor: PocketLab G-Force (Voyager/Voyager 2 also compatible) | Grades: 6–12 | Standards: MS-PS3-1, MS-PS3-5, HS-PS3-1, HS-PS3-2
What students will do: Roll a cart down a ramp at three different masses, record real-time velocity data at four positions, calculate GPE and KE, account for thermal energy losses from friction, and confirm the Law of Conservation of Energy with their own data.
The interactive, auto-graded version of this lab is available free in PocketLab Notebook. See the link at the top of each section below.
Does a falling object have potential energy or kinetic energy or both? In other potential energy experiments, we demonstrated the Law of Conservation of Energy: energy can neither be created nor destroyed, but instead, energy transfers from one form to another. In this investigation, we will take a look at the role of gravity in energy transfer. This investigation aligns with NGSS MS-PS3-1 and MS-PS3-5 and can be scaled up for high school students to address HS-PS3-1 and HS-PS3-2.
TEACHERS: Find the assignable, interactive version of this lesson in PocketLab Notebook here.
The disciplinary core idea behind this standard is PS2.A: Definitions of Energy. It specifically looks at energy in motion (kinetic energy) and its relationship with the mass of the object in motion and the speed of the object. In the setup of the lab, students use a cart traveling down to test how changing the cart's changing speed will affect its kinetic energy and how changing the mass of the cart will change its kinetic energy. A PocketLab Voyager is placed on either the wheel of the cart or directly on top of the cart, in order to measure its speed as it travels down a ramp.
At different points down the ramp, students calculate the gravitational potential energy and the kinetic energy of the cart. In their calculations they will understand the relationship between GPE and KE, helping them with a deeper understanding of concepts in energy conservation, Crosscutting Concepts, Scale Proportion, and Quantity. In the crosscutting concepts (specifically how mass and velocity relate to kinetic energy and how mass and height relate to gravitational potential energy). For every run, students must use the Science and Engineering Practice, Analyzing and Interpreting Data, to process how the changing variables affect the collected velocity data and the calculated kinetic energy data. In the data analysis, students must also show in tables and graphs how the potential and kinetic energy changes in relation to the distance the cart has traveled, the speed of the cart, and the mass of the cart.
MS-PS2-2: Construct and interpret graphical displays of data to describe the relationship between kinetic energy to the mass of an object and the speed of the object.
The standard is broken down into the three NGSS pillars below:
Science and Engineering Practices - Analyzing and Interpreting Data
Disciplinary Core Ideas - PS3.A Definitions of Energy
Crosscutting Concepts - Scale, Proportion, and Quantity
Potential energy is energy that is stored in an object. Potential energy can transfer into other forms of energy like kinetic energy. Kinetic energy is the energy an object has because of its motion.
A ball held in the air, for example, has gravitational potential energy. If released, as the ball moves faster and faster toward the ground, the force of gravity will transfer the potential energy to kinetic energy. The higher the ball, the more gravitational potential energy -- it will fall longer and faster as it accelerates toward the earth.
Now, if two balls are dropped from the same height, but one has more mass, which ball will require more energy to stop? Which ball, therefore, has more kinetic energy?
We can prove this with a science experiment using your PocketLab.
In this experiment, students will:
Define the following:
Formulas for lab:
GPE = mghKE = ½ mv^2
Write a prediction to answer the following question: If the mass of the cart is increased, how will the cart’s GPE, KE, TE, and Velocity be affected as the cart rolls down the ramp? Explain your hypothesis with either background knowledge about energy, forces, and motion and/or information gathered in the introduction and diagrams below.
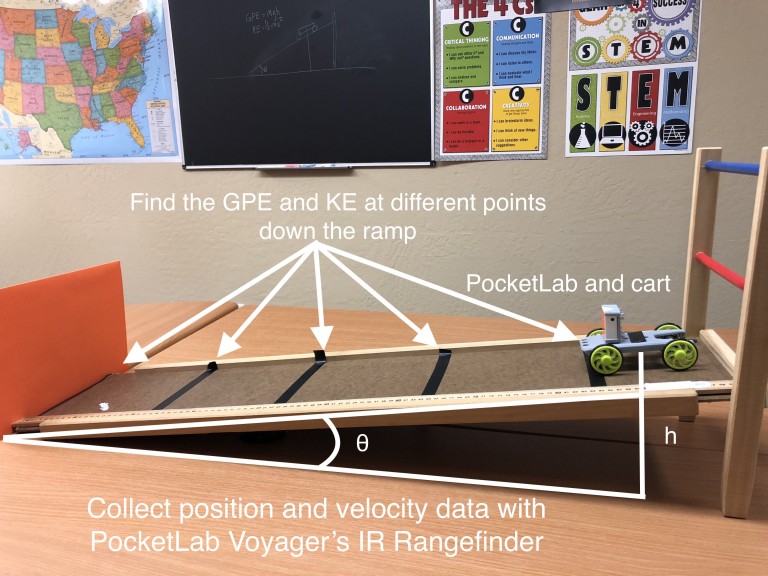
To measure position and velocity, use either the VelocityLab App (PocketLab One or PocketLab Voyager) or the infrared rangefinder sensor (PocketLab Voyager only).
Infrared Rangefinder (PocketLab Voyager)
Follow the steps below:
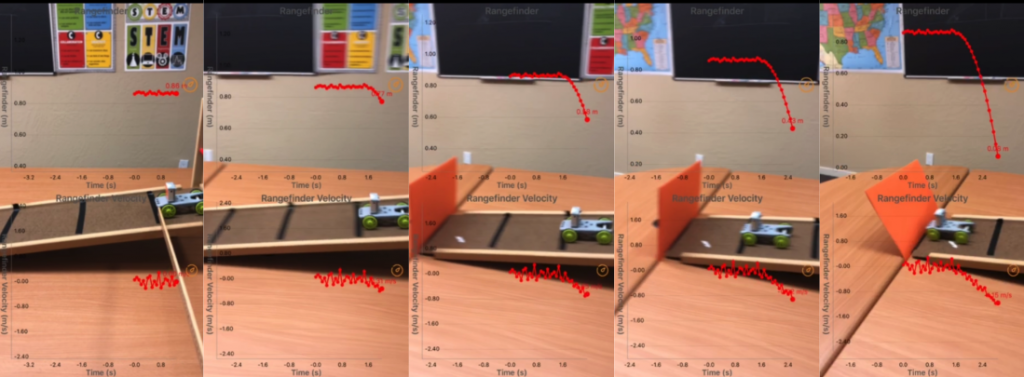 Example of PocketLab Voyager on cart measuring position and velocity with IR Rangefinder at different points down the ramp
VelocityLab App (PocketLab Voyager or PocketLab One. Not compatible with Voyager 2 or G-Force)
Follow the steps below:
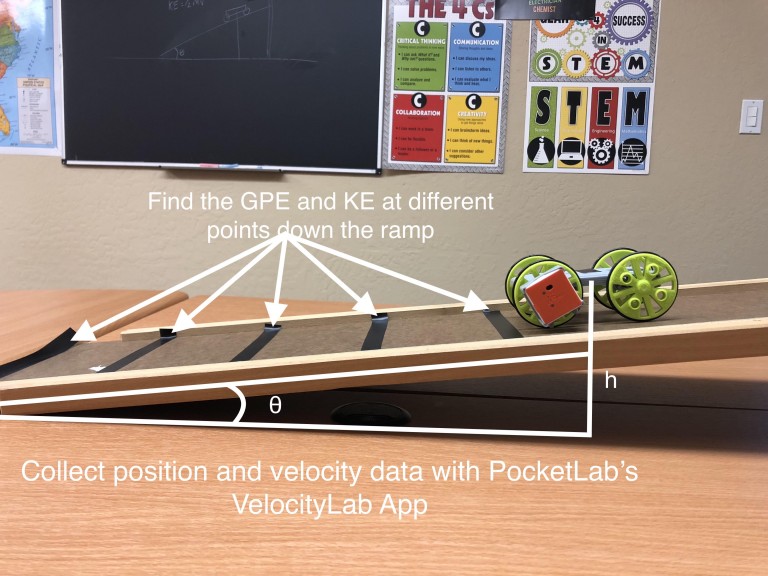
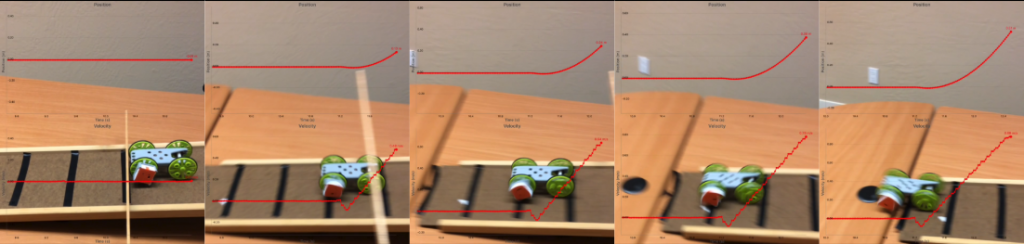 Example of PocketLab on cart measuring position and velocity at different points down a ramp with PocketLab's VelocityLab App.
Control Variables for Every Run
For every new run, you will change the independent variable but keep a set of control variables the same. This is to make sure the experiment is accurate. Record these control variables below:
Control Variables
| Angle of ramp | |
| Height of cart at top of ramp | |
| Distance cart will travel down the ramp |
Independent Variables for Every Run
For every run you will be testing an independent variable. You will change the value o this variable to see how the change affects your dependent variables, measured in your data and seen in your observations.
| Independent Variable | Mass of Cart |
Data Collection for Run 1
Find the mass of the cart with the PocketLab attached and record it as the value of your Independent Variable for Run 1.
Independent Variable
| Mass of Cart |
| Run 1 Observations: |
Run 1 - Trial 1
| Height of cart (m) | |||||
| Displacement (m) | |||||
| Velocity (m/s) | |||||
|
GPE (J) |
|||||
|
KE (J) |
Run 1 - Trial 2
| Height of cart (m) | |||||
| Displacement (m) | |||||
| Velocity (m/s) | |||||
|
GPE (J) |
|||||
|
KE (J) |
Run 1 - Trial 3
| Height of cart (m) | |||||
| Displacement (m) | |||||
| Velocity (m/s) | |||||
|
GPE (J) |
|||||
|
KE (J) |
Data Collection for Run 2
Add a mass from your mass set to the cart. Find the new mass of the cart with PocketLab and added mass and record it as the value of your Independent Variable for Run 2.
Independent Variable
| Mass of Cart |
| Run 2 Observations |
Run 2 - Trial 1
| Height of cart (m) | |||||
| Displacement (m) | |||||
| Velocity (m/s) | |||||
|
GPE (J) |
|||||
|
KE (J) |
Run 2 - Trial 2
| Height of cart (m) | |||||
| Displacement (m) | |||||
| Velocity (m/s) | |||||
|
GPE (J) |
|||||
|
KE (J) |
Run 2 - Trial 3
| Height of cart (m) | |||||
| Displacement (m) | |||||
| Velocity (m/s) | |||||
|
GPE (J) |
|||||
|
KE (J) |
Data Collection for Run 3
Add a mass from your mass set to the cart. Find the new mass of the cart with PocketLab and added mass and record it as the value of your Independent Variable for Run 3.
Independent Variable
| Mass of Cart |
| Run 3 Observations |
Run 3 - Trial 1
| Height of cart (m) | |||||
| Displacement (m) | |||||
| Velocity (m/s) | |||||
|
GPE (J) |
|||||
|
KE (J) |
Run 3 - Trial 2
| Height of cart (m) | |||||
| Displacement (m) | |||||
| Velocity (m/s) | |||||
|
GPE (J) |
|||||
|
KE (J) |
Run 3 - Trial 3
| Height of cart (m) | |||||
| Displacement (m) | |||||
| Velocity (m/s) | |||||
|
GPE (J) |
|||||
|
KE (J) |
Average the trials from each run below. Leave the bottom two rows of each table empty for now.
Run 1 Average
| Height of cart (m) | |||||
| Displacement (m) | |||||
| Velocity (m/s) | |||||
|
GPE (J) |
|||||
|
KE (J) |
Run 2 Average
| Height of cart (m) | |||||
| Displacement (m) | |||||
| Velocity (m/s) | |||||
|
GPE (J) |
|||||
|
KE (J) |
Run 3 Average
| Height of cart (m) | |||||
| Displacement (m) | |||||
| Velocity (m/s) | |||||
|
GPE (J) |
|||||
|
KE (J) |
Option 1: Write a concluding paragraph that answers the Conclusion Questions at the bottom of the page.
Option 2: Write a full lab report for this lab activity. A lab report is a great way to summarize how you conducted your experiment and tested your hypothesis, the data collected, and any conclusions you can draw about the scientific question that was tested. In your lab report include:
TEACHERS: Find the assignable, interactive version of this lesson in PocketLab Notebook here.
If the mass of the cart increases, I predict the cart's GPE, KE, TE, and Velocity will all increase. I believe the added mass will make the cart go faster down the ramp which will also cause the KE of the cart to increase because KE = 1/2 mv^2. I believe the GPE will increase because the equation for GPE (GPE = mgh) shows that increasing either the mass or the height of the object will increase the GPE. I believe the TE of the cart will increase because both the GPE and KE will increase.
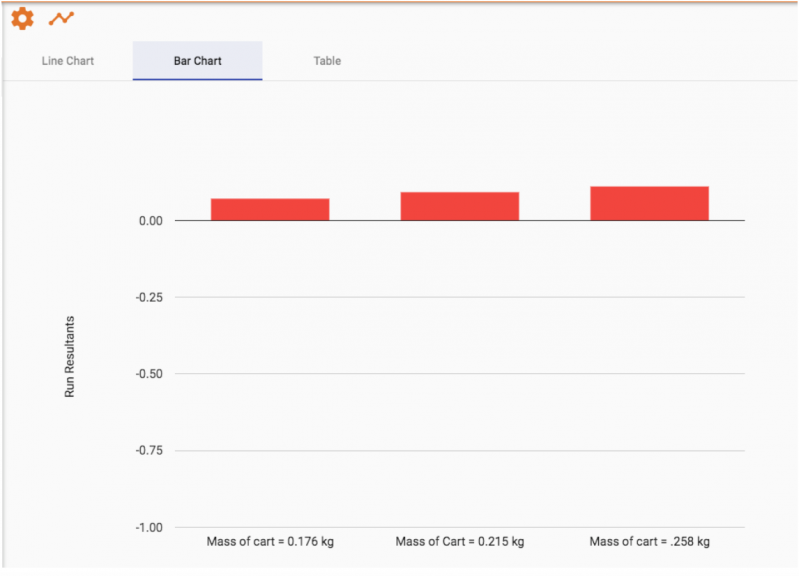
Using PocketLab Voyager and the VelocityLab App, we ran the cart down the ramp starting .50 m up the ramp. The height of the cart (measured directly from the ground) at .50 m up the ramp was 0.12 m. One-quarter of the way down the ramp, the height of the cart was 0.08 m, 1/2 down the ramp it was .06 m, 3/4 of the way down the ramp it was 0.03m, and all the way down the ramp was 0.0 m. This data, along with the mass of the cart was used to calculate the GPE of the cart at different locations. Using the Position and Velocity data from VelocityLab, we found the velocity of the cart 1/4, 1/2, 3/4, and all the way down the ramp. This was used to calculate the KE of the cart. We conducted three runs for this experiment. At each run, we increased the mass of the cart to see how it affected the GPE, KE, Velocity, and TE of the cart. For each run, we conducted three trials and averaged our results. For our "Resultant Visualization" we compared the increase in the cart's mass to the average KE of the cart at the bottom of the ramp for each run.
Run 1
| Independent Variable |
| Mass of Cart | 0.176kg |
|
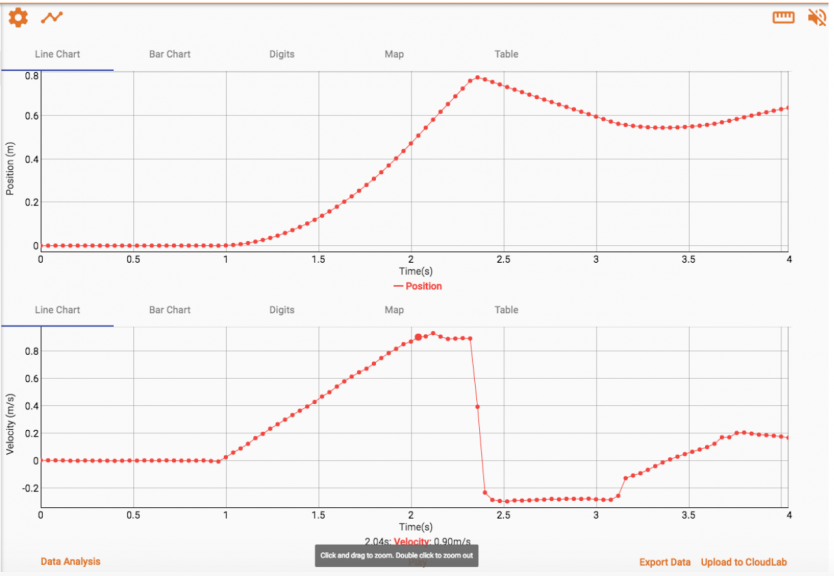
Run 1 Observations The velocity data 1/4, 1/2, 3/4, and all the way down the ramp were fairly consistent across the three trials. The GPE of the cart was the same across trials. The KE of the cart was also consistent across trials. The resultant data listed here is the average top KE at the bottom of the ramp across all three trials. Resultant for Data Visualizations: KE at bottom of ramp = 0.071 J |
Run 1 Trial 3 (Velocity at bottom of ramp = 0.90 m/s)
Run 2
| Independent Variable |
| Mass of Cart | 0.215 kg |
|
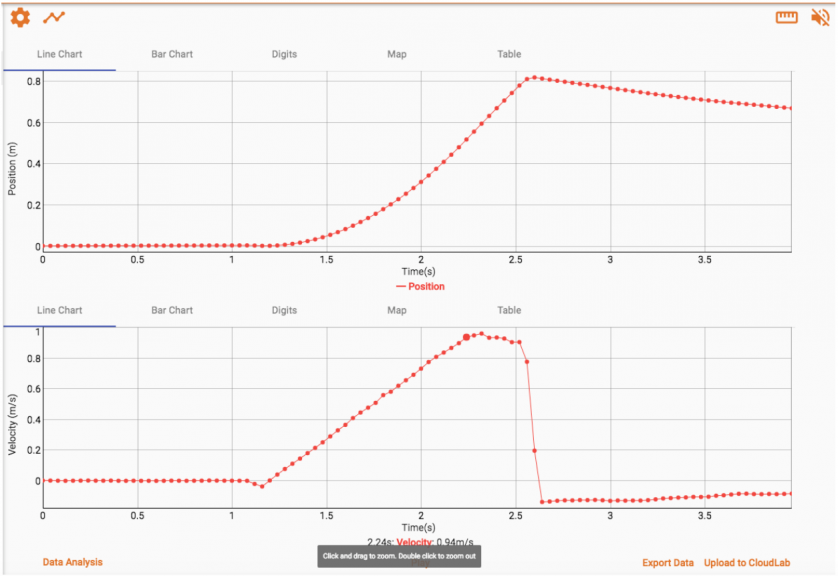
Run 2 Observations As the cart traveled down the ramp, we noticed that the velocities at different points didn't change much from the data in Trial 1. The added mass didn't seem to have an effect on the velocity of the cart as it went down the ramp. The Kinetic Energy calculated increased, but that seemed to be a result of the increasing mass in the equation, not an increase in Velocity. The resultant shows the average Kinetic Energy of the cart at the bottom of the ramp. Resultant for Data Visualization: KE at bottom of ramp = 0.092 J |
Run 2 Trial 3 (Velocity at bottom of ramp = 0.94 m/s)
Run 3
| Independent Variable |
| Mass of Cart | 0.258 kg |
|
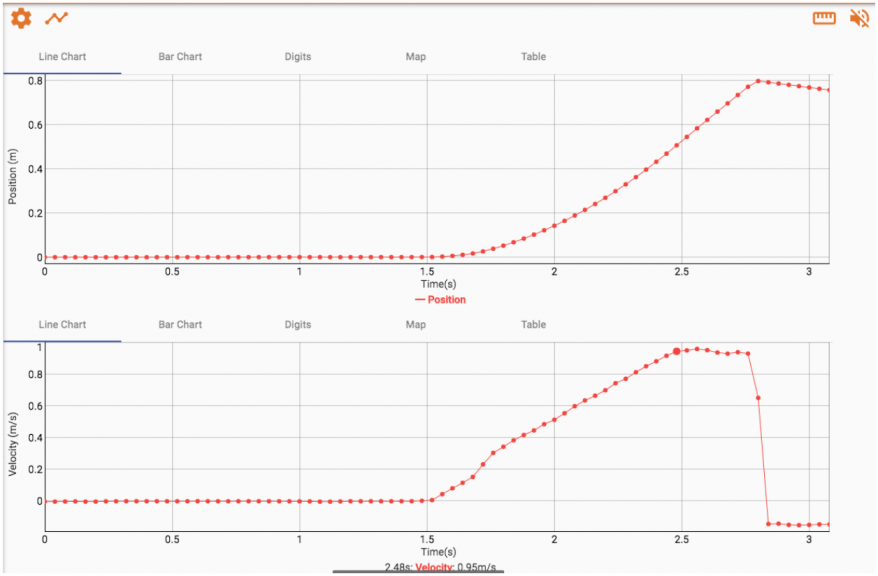
Run 3 Observations Similar to Run 2, the added mass did not affect the velocity of the cart at any point. The GPE and KE of the cart increased as the mass increased compared with Runs 1 and 2. The resultant data is the average KE of the cart at the bottom of the ramp. Resultant for Data Visualization: KE at bottom of ramp = 0.111 J |
Run 3 Trial 3 (Velocity at bottom of ramp = 0.95 m/s)
We averaged our results across all trials for each run. The results are in our included data tables. When looking at the average data for Run 1, we determined that adding the GPE and KE at every location did not give us the Total Energy in the system. Data was missing. The total energy should stay the same throughout the cart's trip down the ramp because energy does not simply disappear. It can change form but not be destroyed. This means some of the GPE was not just transferring to KE. Some was also transferred to another type of energy.
Looking back at our Key Words from the beginning of the lab, we determined some of the energy was transferring to Thermal Energy through the process of Friction. By subtracting the GPE and the KE from what should be the Total Energy at each location we were able to determine an approximate value for the Thermal Energy at each location. We added this to our data tables for each Run average.
We then drew bar graphs breaking down the type of energy at each location for each of the Run averages. We noticed that no matter what, the bar graph for Total Energy was always equal to the sum of the bar graphs for GPE, KE, and Thermal Energy. The values of those bar graphs changed between those three types of energy, but their sum was always the same. When the mass increased in Runs 2 and 3, the Total Energy increased, but the pattern shown in the bar graphs was the same. Increasing mass had no effect on velocity data, however.
| Run 1 Average |
| Height of cart (m) | 0.12 | 0.08 | 0.06 | 0.03 | 0.00 |
| Displacement (m) | 0.000 | 0.123 | 0.253 | 0.737 | 0.500 |
| Velocity (m/s) | 0 | 0.433 | 0.650 | 0.787 | 0.900 |
| GPE (J) | 0.207 | 0.138 | 0.103 | 0.052 | 0.000 |
| KE (J) | 0.000 | 0.017 | 0.037 | 0.054 | 0.071 |
| Therm. Energy (J) | 0.000 | 0.052 | 0.067 | 0.101 | 0.136 |
| Total Energy | 0.207 | 0.207 | 0.207 | 0.207 | 0.207 |
| Run 2 Average |
| Height of cart (m) | 0.12 | 0.08 | 0.06 | 0.03 | 0.00 |
| Displacement (m) | 0.000 | 0.123 | 0.253 | 0.377 | 0.503 |
| Velocity (m/s) | 0.000 | 0.453 | 0.663 | 0.813 | 0.927 |
| GPE (J) | 0.253 | 0.169 | 0.126 | 0.063 | 0.000 |
| KE (J) | 0.000 | 0.022 | 0.047 | 0.071 | 0.092 |
| Therm. Energy (J) | 0.000 | 0.062 | 0.080 | 0.119 | 0.161 |
| Total Energy | 0.253 | 0.253 | 0.253 | 0.253 | 0.253 |
| Run 3 Average |
| Height of cart (m) | 0.12 | 0.08 | 0.06 | 0.03 | 0.00 |
| Displacement (m) | 0.000 | 0.123 | 0.257 | 0.373 | 0.500 |
| Velocity (m/s) | 0.000 | 0.457 | 0.667 | 0.810 | 0.927 |
| GPE (J) | 0.303 | 0.202 | 0.152 | 0.076 | 0.000 |
| KE (J) | 0.000 | 0.027 | 0.057 | 0.085 | 0.192 |
| Therm. Energy (J) | 0.000 | 0.074 | 0.121 | 0.142 | 0.192 |
| Total Energy | 0.303 | 0.303 | 0.303 | 0.303 | 0.303 |
Resultant Data Visualization: Mass of the cart compared to average Kinetic Energy of the cart at the bottom of the ramp.
After examining the data, some parts of our hypothesis from the beginning of the lab are invalid while some parts are valid. We predicted that increasing the mass would increase the velocity of the cart and the KE of the cart. Increasing the mass of the cart had no effect on the velocity of the cart, and while the KE did increase, this was because of the increase in mass, not an increase in velocity, which is what we predicted. We believe the increased mass of the cart had no effect on the velocity because gravity accelerates all objects near Earth's surface at approximately the same rate, regardless of mass. We were correct in predicting that the increase in mass would increase the GPE of the cart because increasing either mass or height increases GPE. We were also correct in predicting that the Total Energy would increase because of the increase in GPE.
TEACHERS: Find the assignable, interactive version of this lesson in PocketLab Notebook here.
Potential energy and kinetic energy are two forms of mechanical energy that continuously exchange with each other. As a cart gains height on a ramp, it stores gravitational potential energy (GPE = mgh). When released, gravity converts that stored energy into kinetic energy (KE = ½mv²) as the cart accelerates downhill. At the bottom of the ramp, nearly all GPE has converted to KE and thermal energy (heat from friction). This exchange is governed by the Law of Conservation of Energy: the total energy of a closed system remains constant.
Gravity exerts a constant downward force on any object with mass. When an object is held at height h, it has gravitational potential energy equal to mgh. As the object falls or rolls downward, gravity does work on it — accelerating it and converting stored potential energy into kinetic energy. The greater the starting height, the more GPE is available to convert, which is why objects dropped from greater heights reach higher final velocities.
The Law of Conservation of Energy states that energy cannot be created or destroyed — only converted from one form to another. In this experiment, gravitational potential energy converts into kinetic energy and thermal energy (heat from friction). The sum of GPE + KE + thermal energy at any point on the ramp always equals the total starting energy. This is one of the most fundamental principles in physics and applies across all energy systems.
No — and this is one of the most surprising outcomes students observe in this lab. Because gravity accelerates all objects near Earth’s surface at approximately 9.8 m/s² regardless of mass, the three cart masses in this experiment produce nearly identical velocity readings at each ramp position. However, heavier carts do have greater kinetic energy at the bottom because KE = ½mv² — the mass term increases KE directly even when velocity stays the same.
Kinetic energy is calculated with the formula KE = ½mv², where m is mass in kilograms and v is velocity in meters per second. Because velocity is squared, doubling speed quadruples kinetic energy. Students use the PocketLab Voyager’s IR Rangefinder to measure velocity at different ramp positions, then apply this formula to calculate KE at each point.
This lab primarily addresses NGSS MS-PS3-1 and MS-PS3-5 (middle school) with extensions for HS-PS3-1 and HS-PS3-2 (high school). The Science and Engineering Practice is SEP 4: Analyzing and Interpreting Data. The Disciplinary Core Idea is PS3.A: Definitions of Energy. The Crosscutting Concept is Scale, Proportion, and Quantity.
Looking for more hands-on physics experiments with real-time data collection? Explore these related activities:
Explore PocketLab Sensor Bundles → Get Free Notebook Access →
1 min read
📡 Flight + Physics = Engagement Drones aren't just cool tech – they're powerful teaching tools. At Nicholls State University, a group of creative...
1 min read
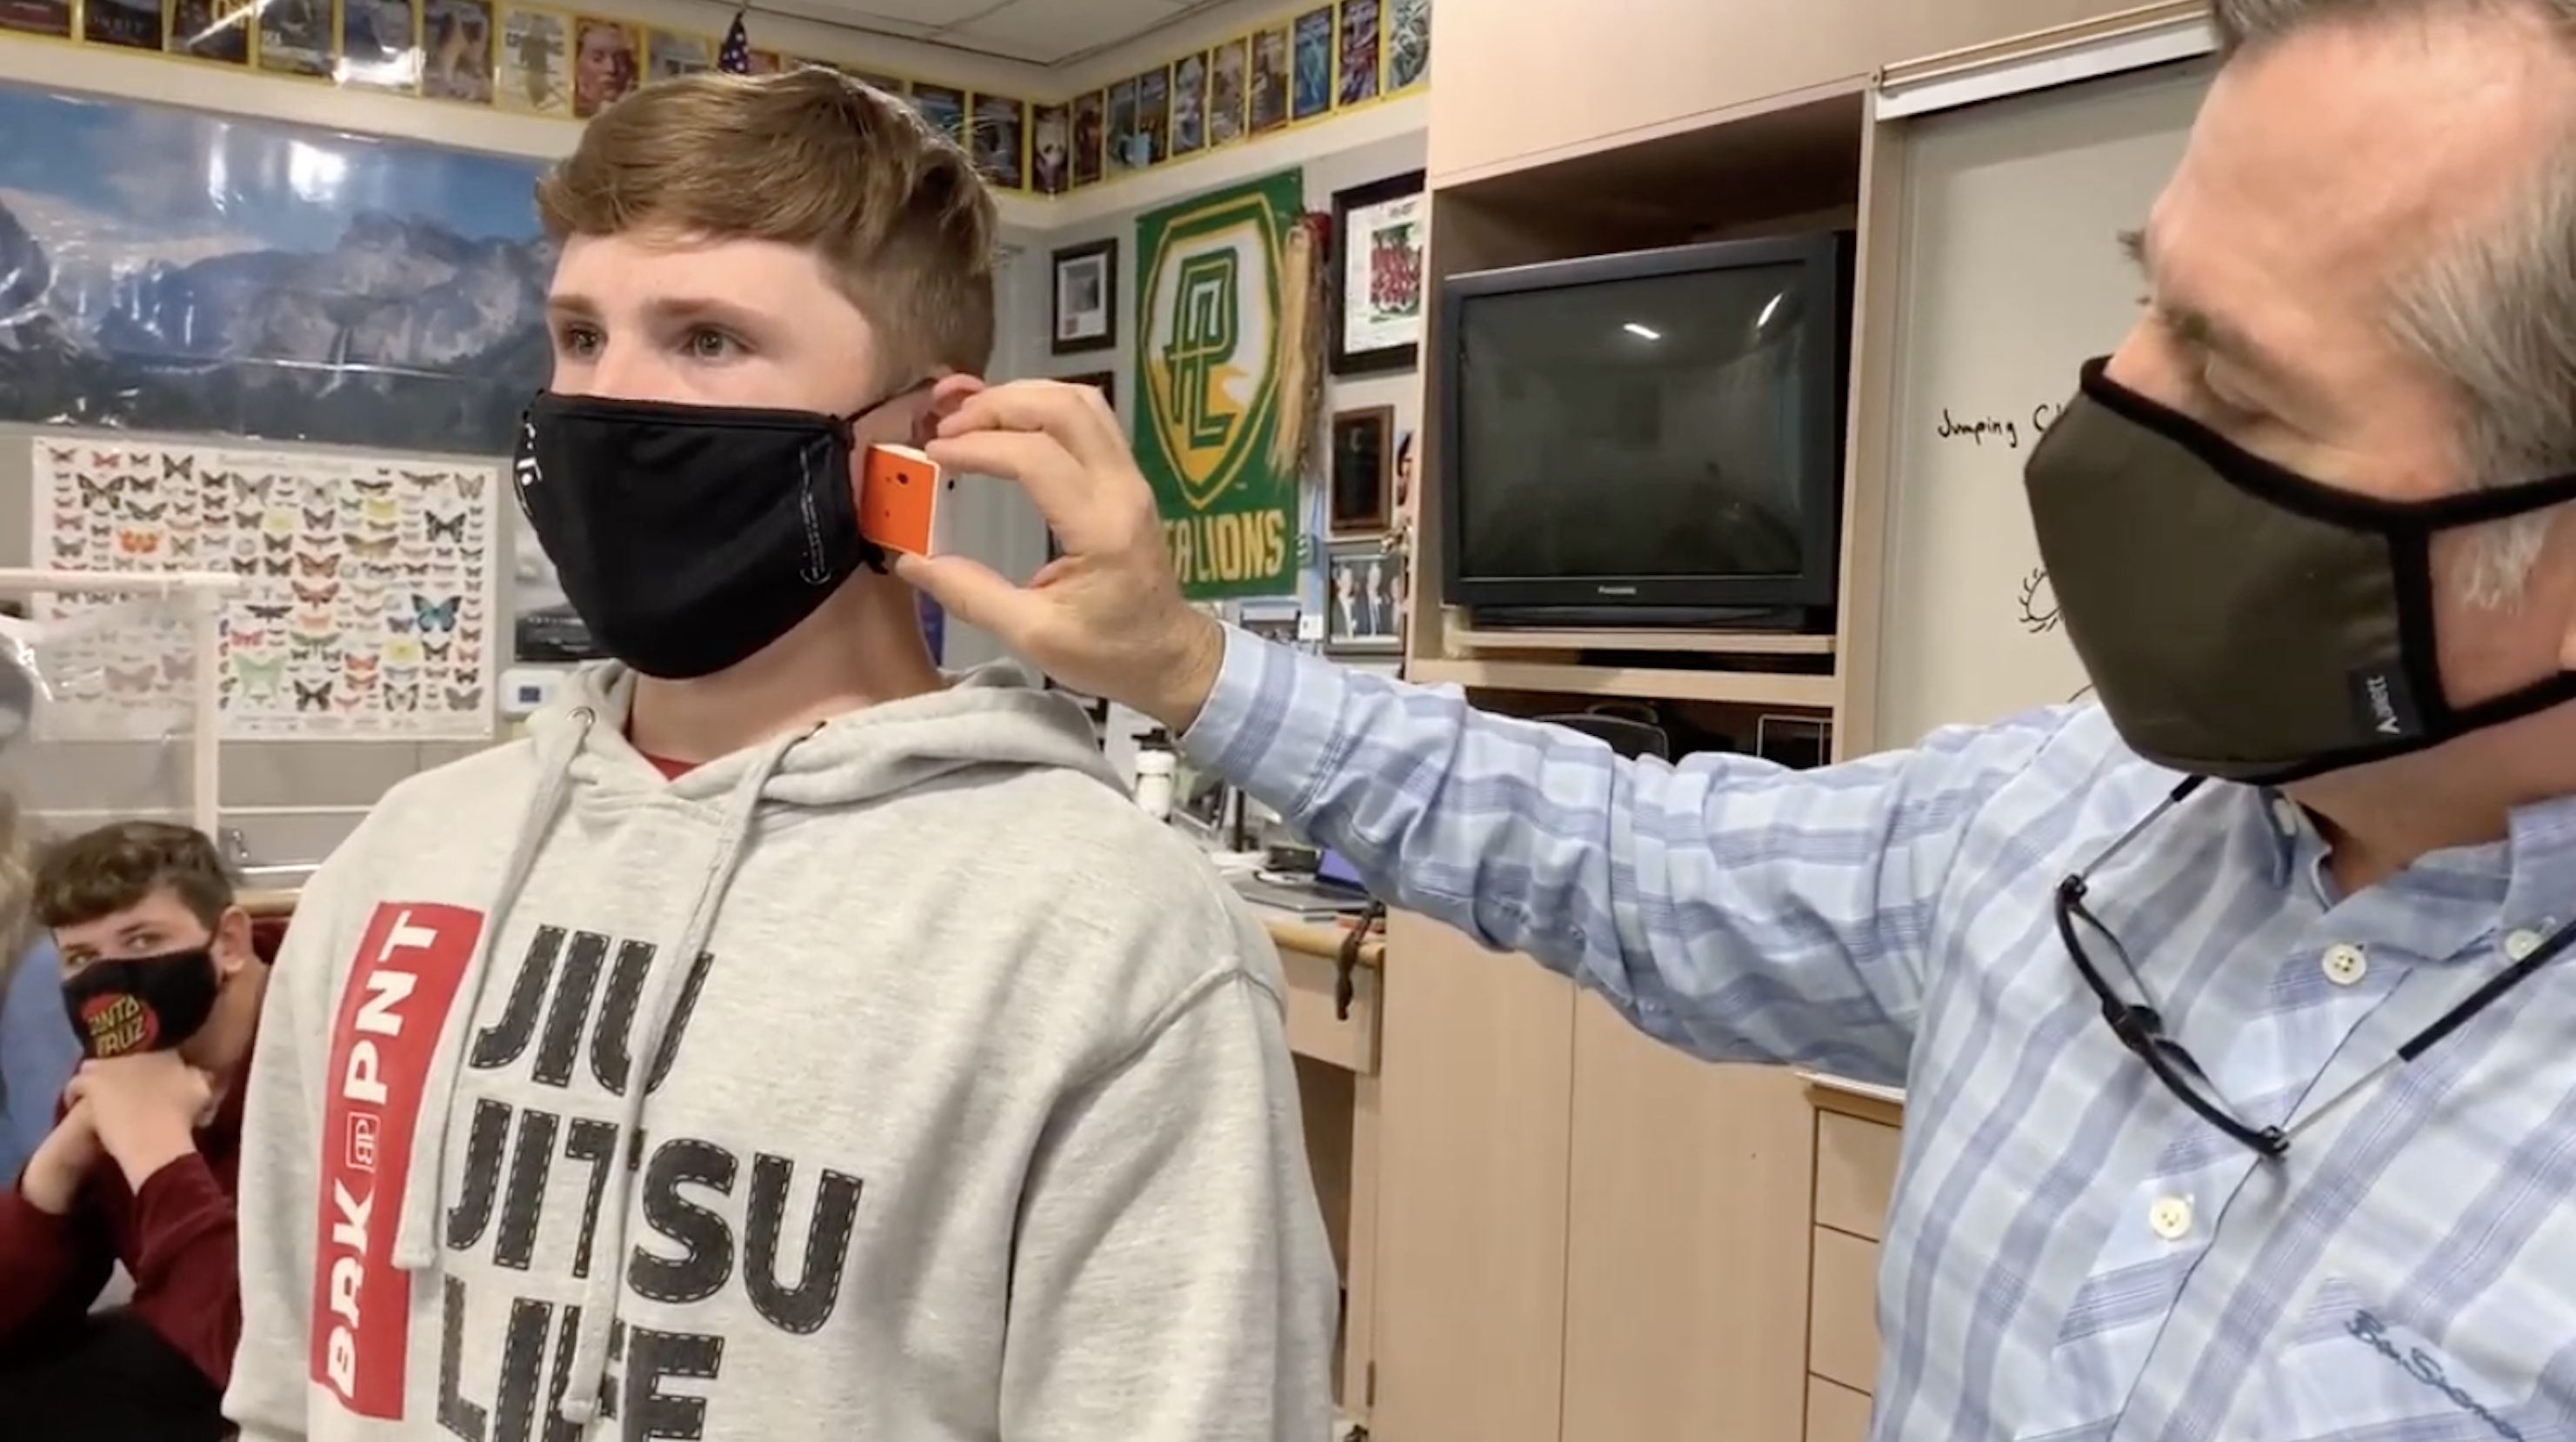
Mr. Vandegrift is using a PocketLab Voyager (But you can also use Weather or Air) to show his students the efficacy of face masks. Through data...
1 min read
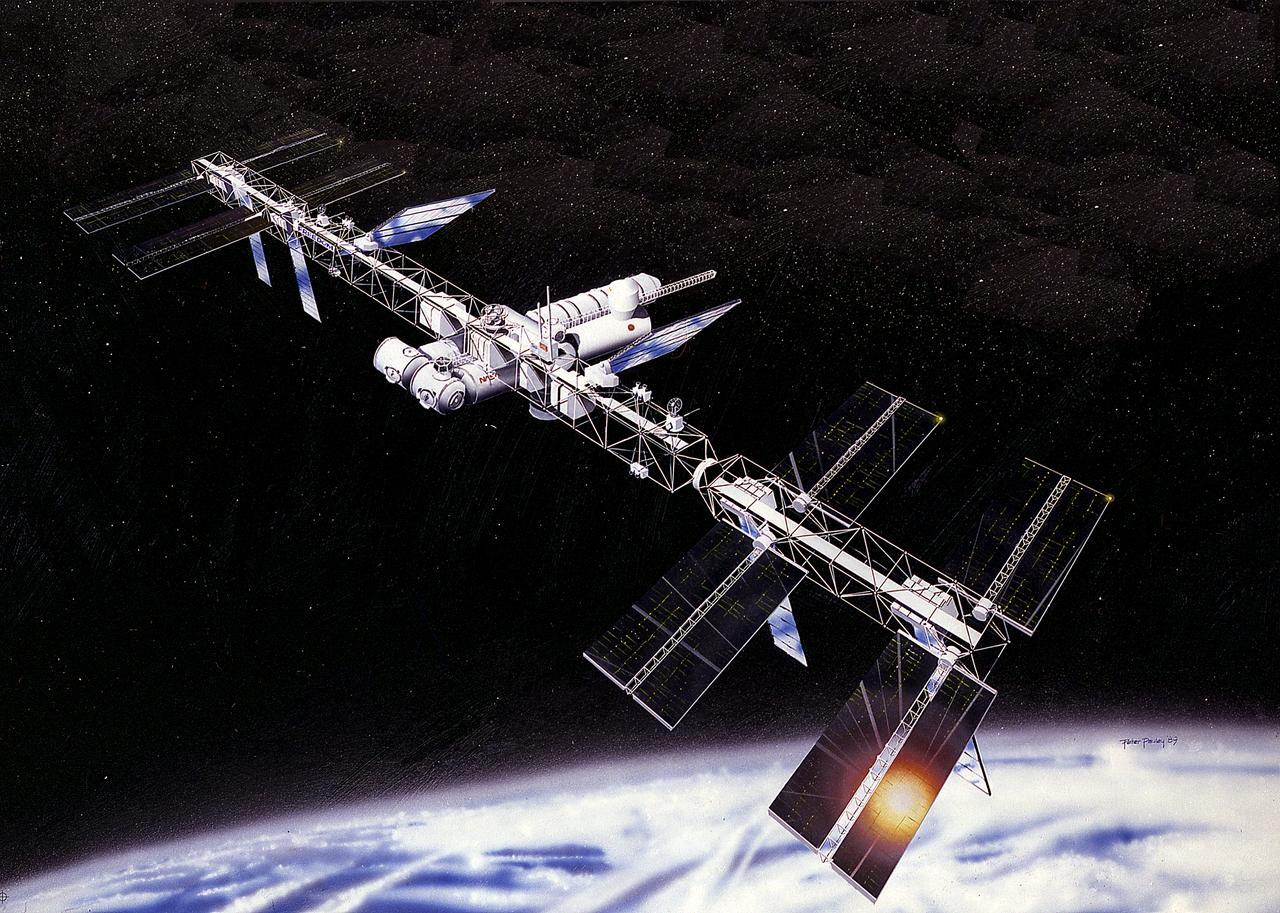
From the Classroom to Orbit: PocketLab Sensors Headed to the ISS 🚀 PocketLab was founded on a simple idea: students learn science best by...